Visualising Urban Water Systems
A series of data visualisations for Melbourne Water — presenting 10 years of water data as a realtime screen installation and large-scale prints for Melbourne's State of Design Festival.
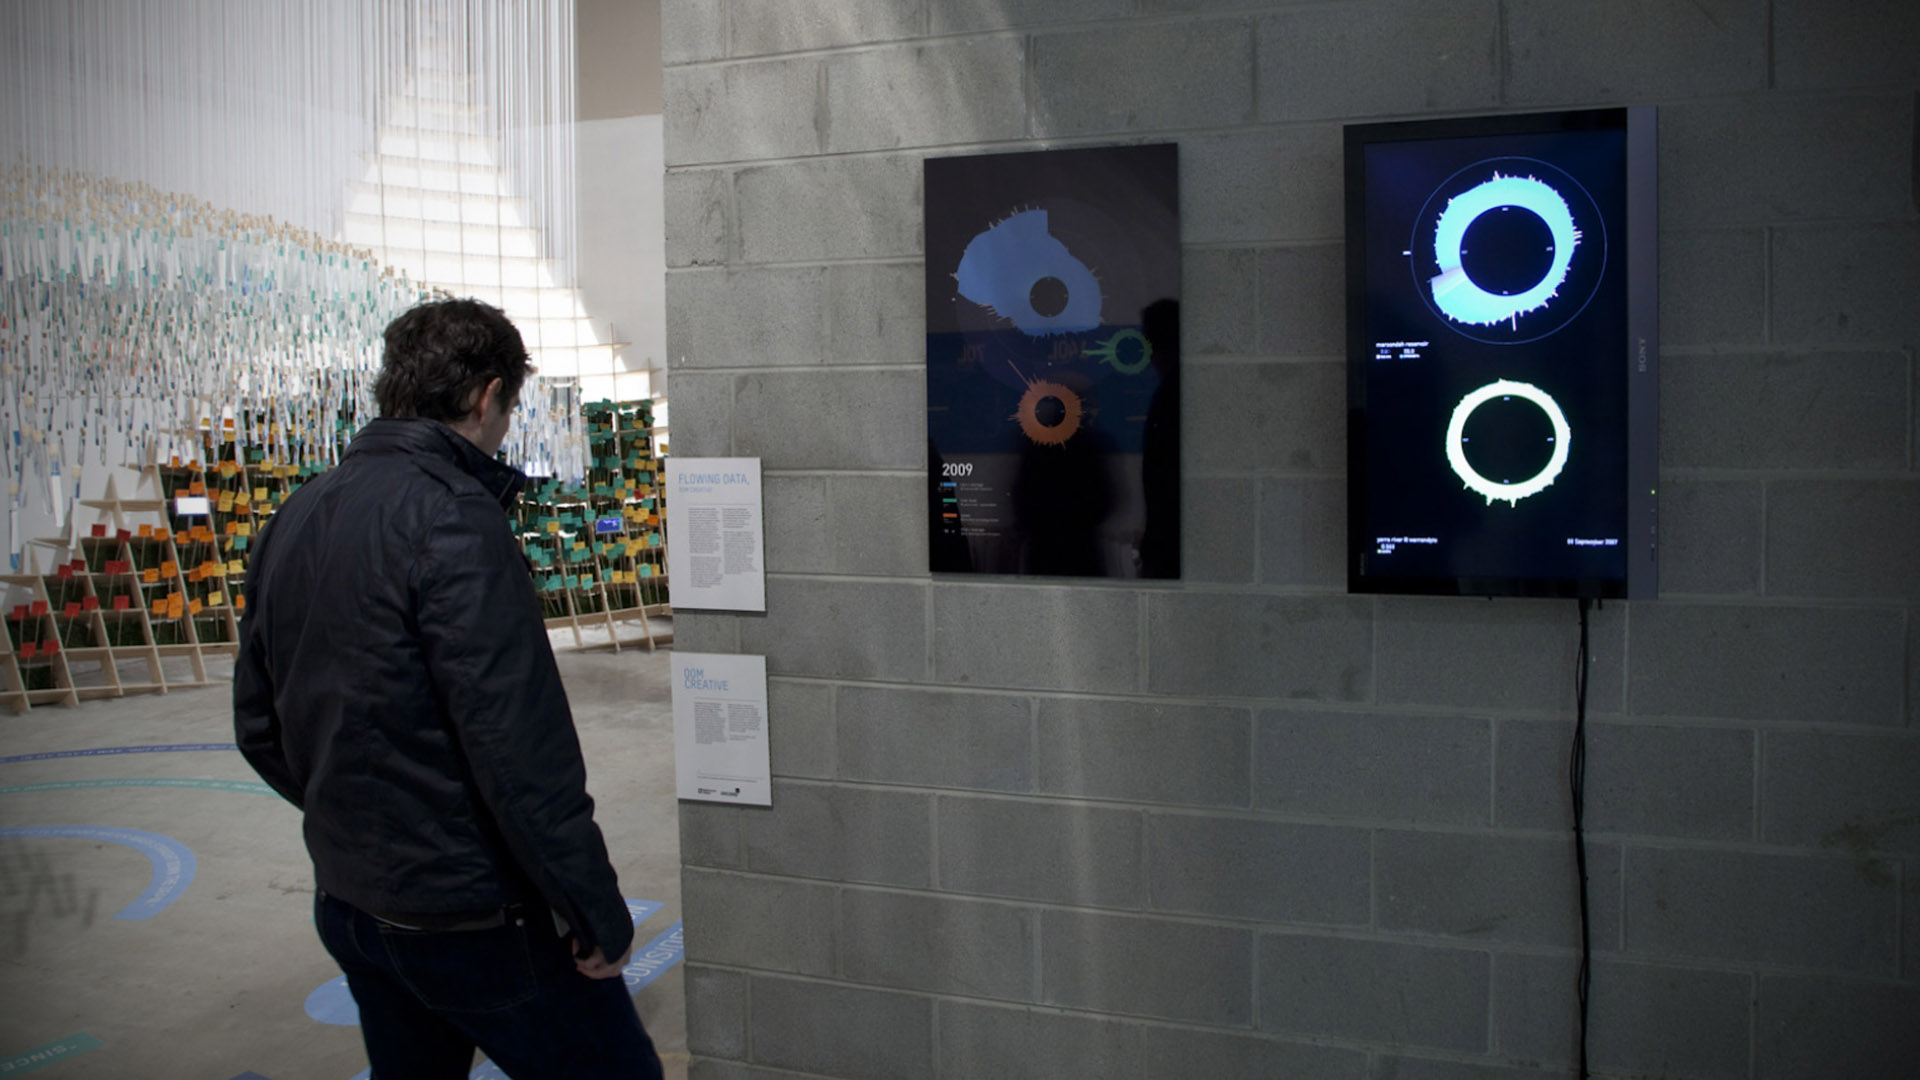
This project for Melbourne Water developed from an exhibition piece in Melbourne’s State of Design Festival into a series of large-scale prints, and was released as an online interactive data visualisation and foyer prints.
Watch the installation on Vimeo →
OOM Creative was selected as one of four innovative design teams for the 2010 State of Design Exhibition entitled Creating Liveable Cities. Sponsored by Melbourne Water, the exhibition examined the issue of water within urban environments. OOM Creative’s response was presenting 10 years of water data as a realtime installation and large-scale prints.
Design Statement
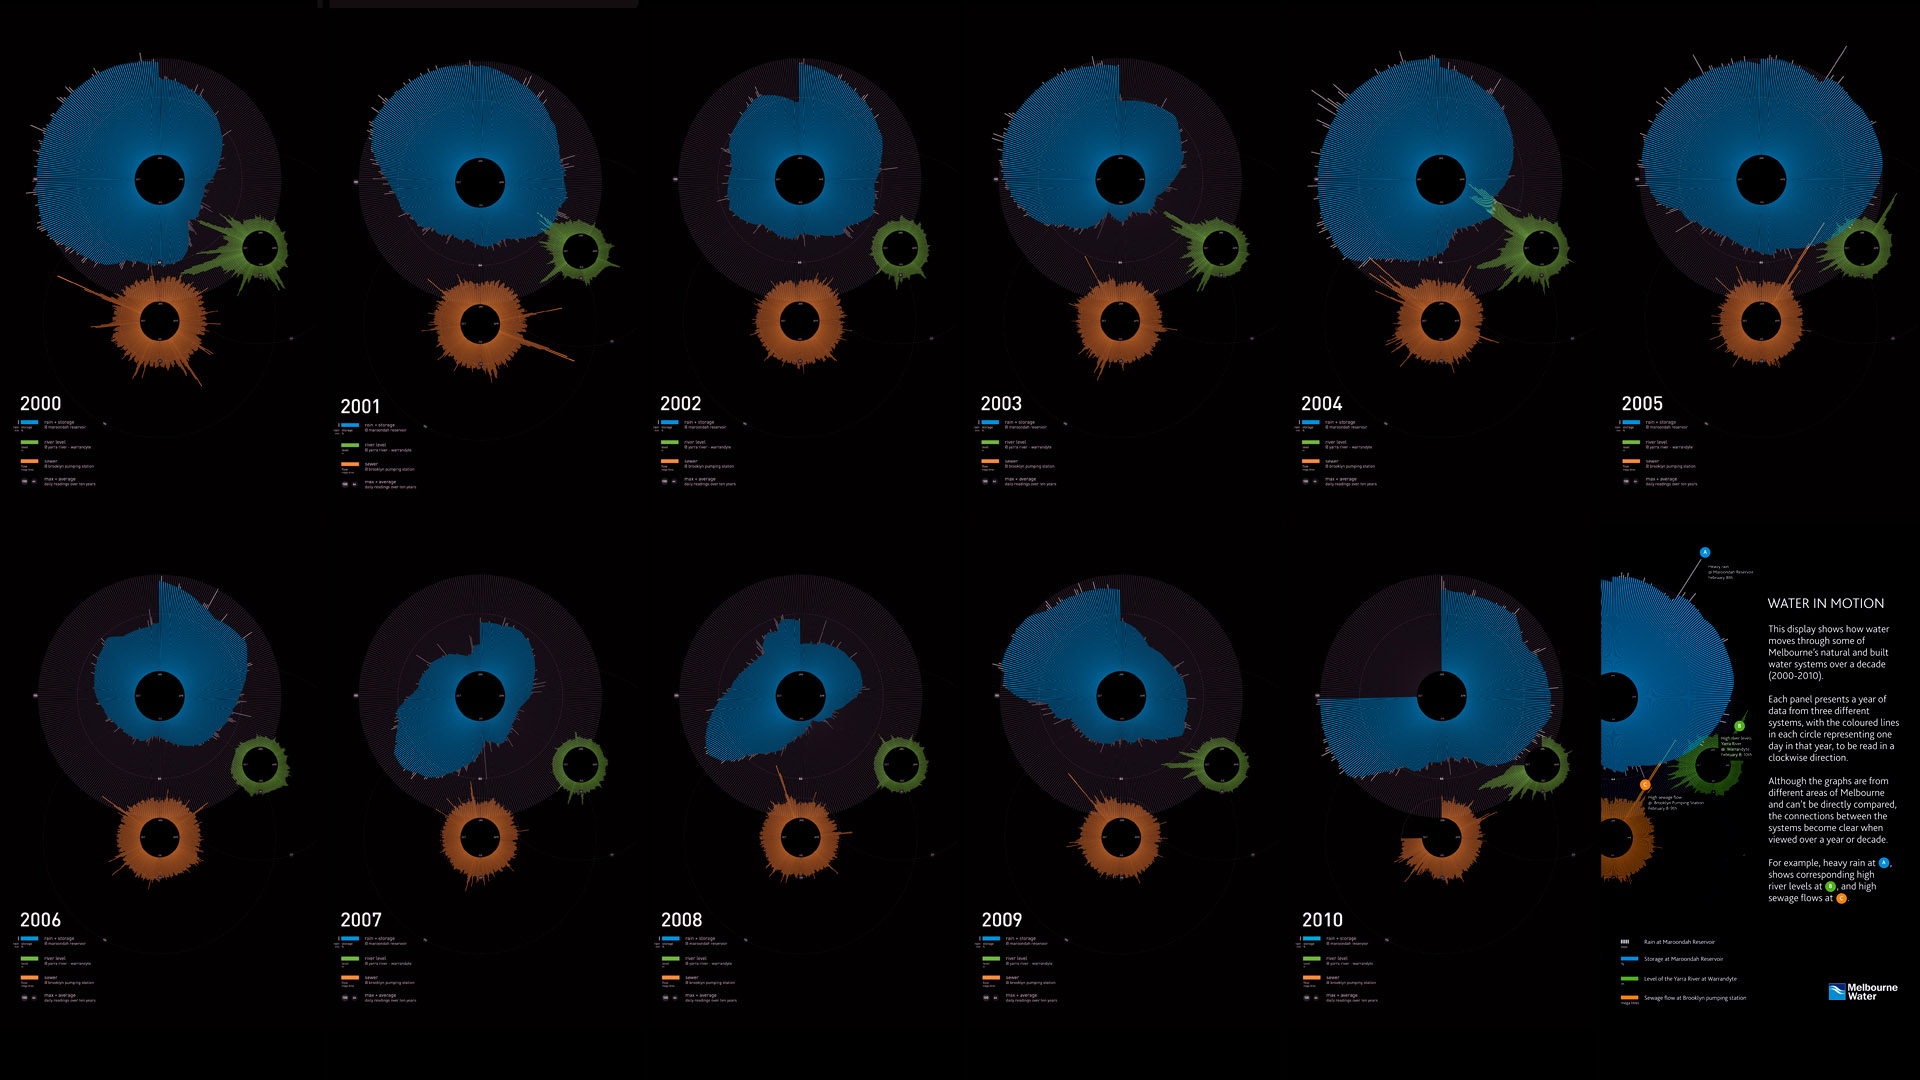
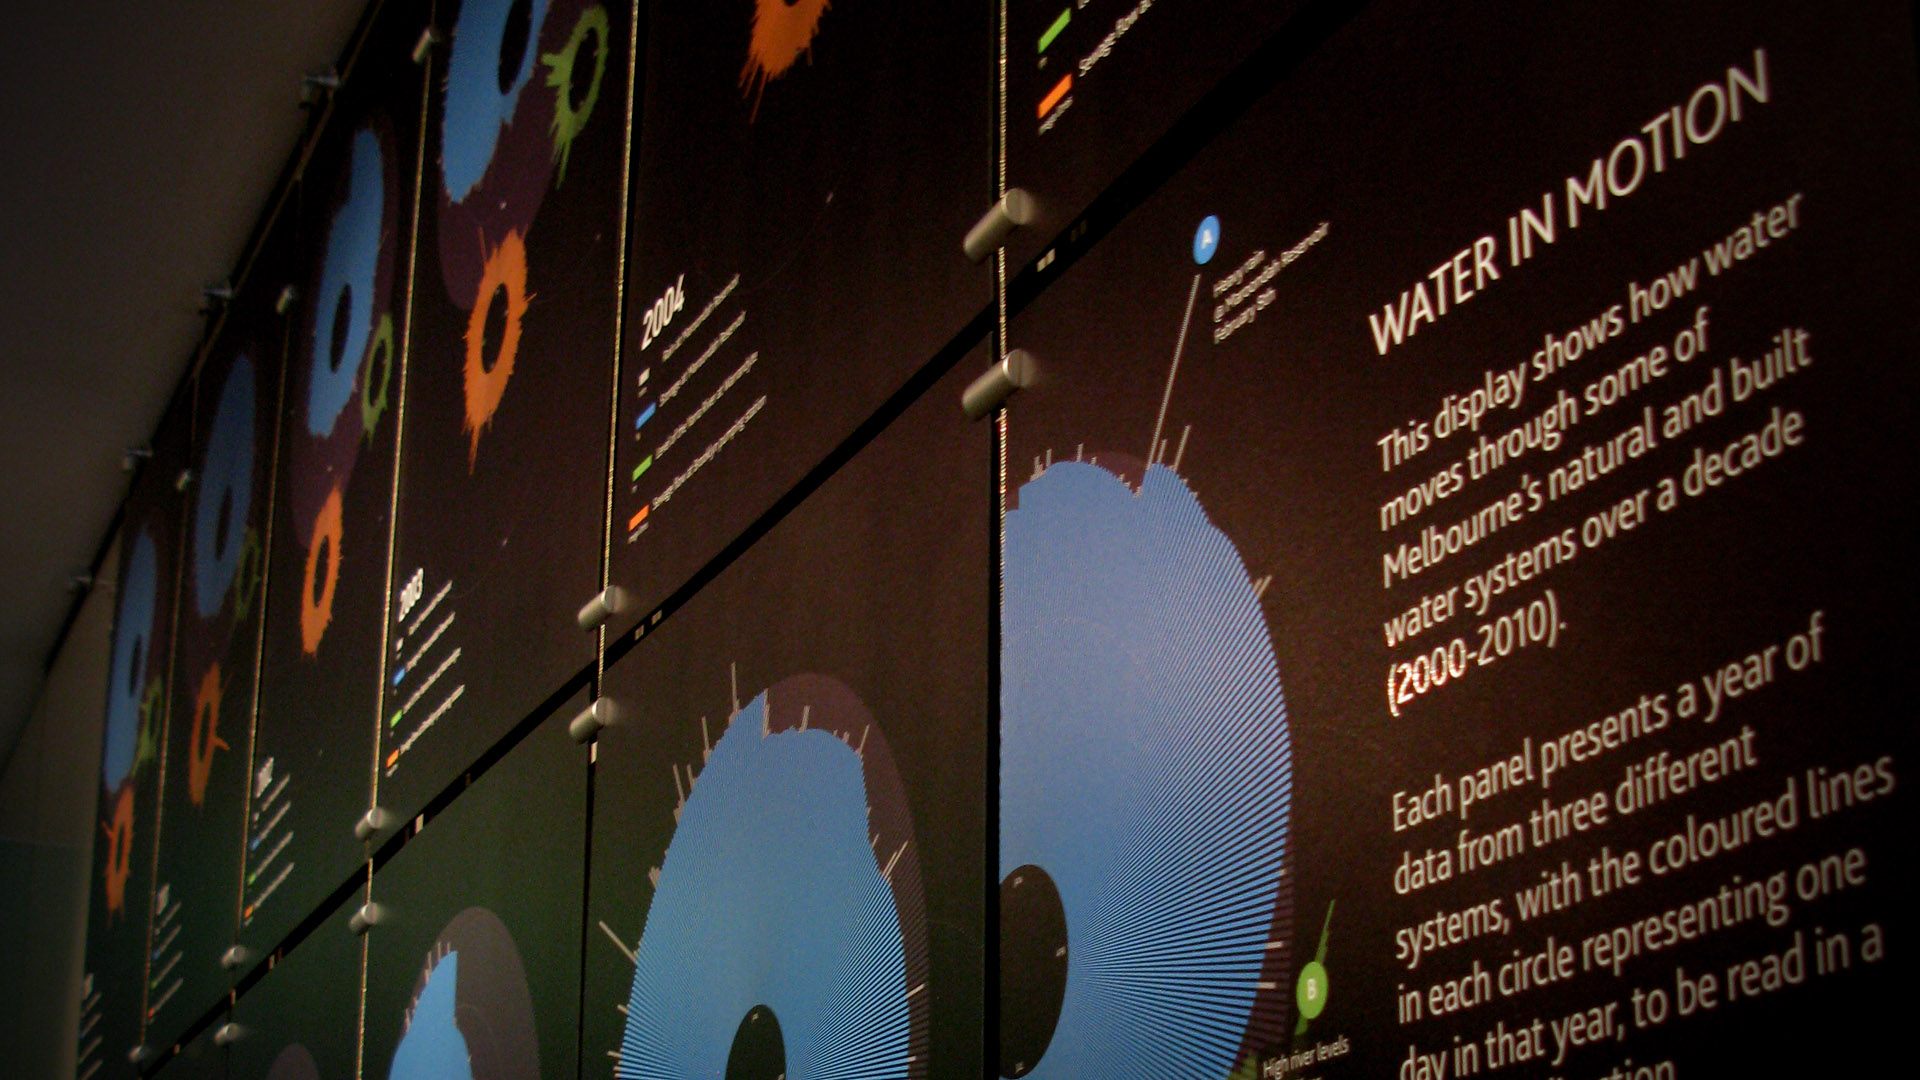
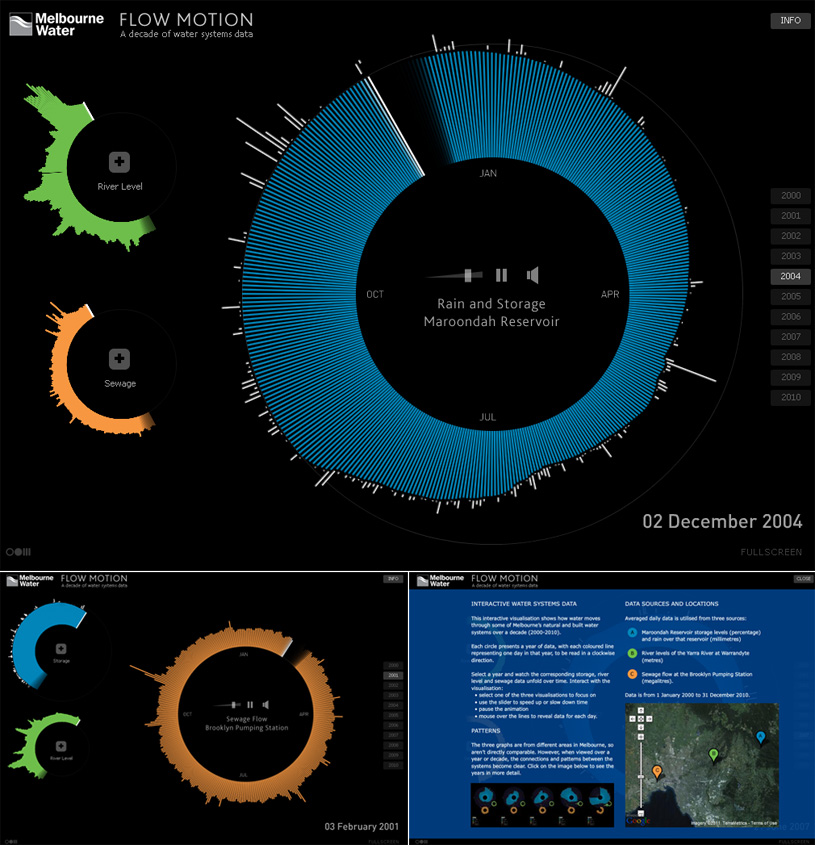
OOM Creative’s challenge was to present 10 years of data from Melbourne’s water systems in an elegant and memorable information visualisation. We were interested in how data could tell a story over time — and through early prototypes — discovered that placing the water data in circular formations generated intriguing and informative shapes; working both as graphics and animations.
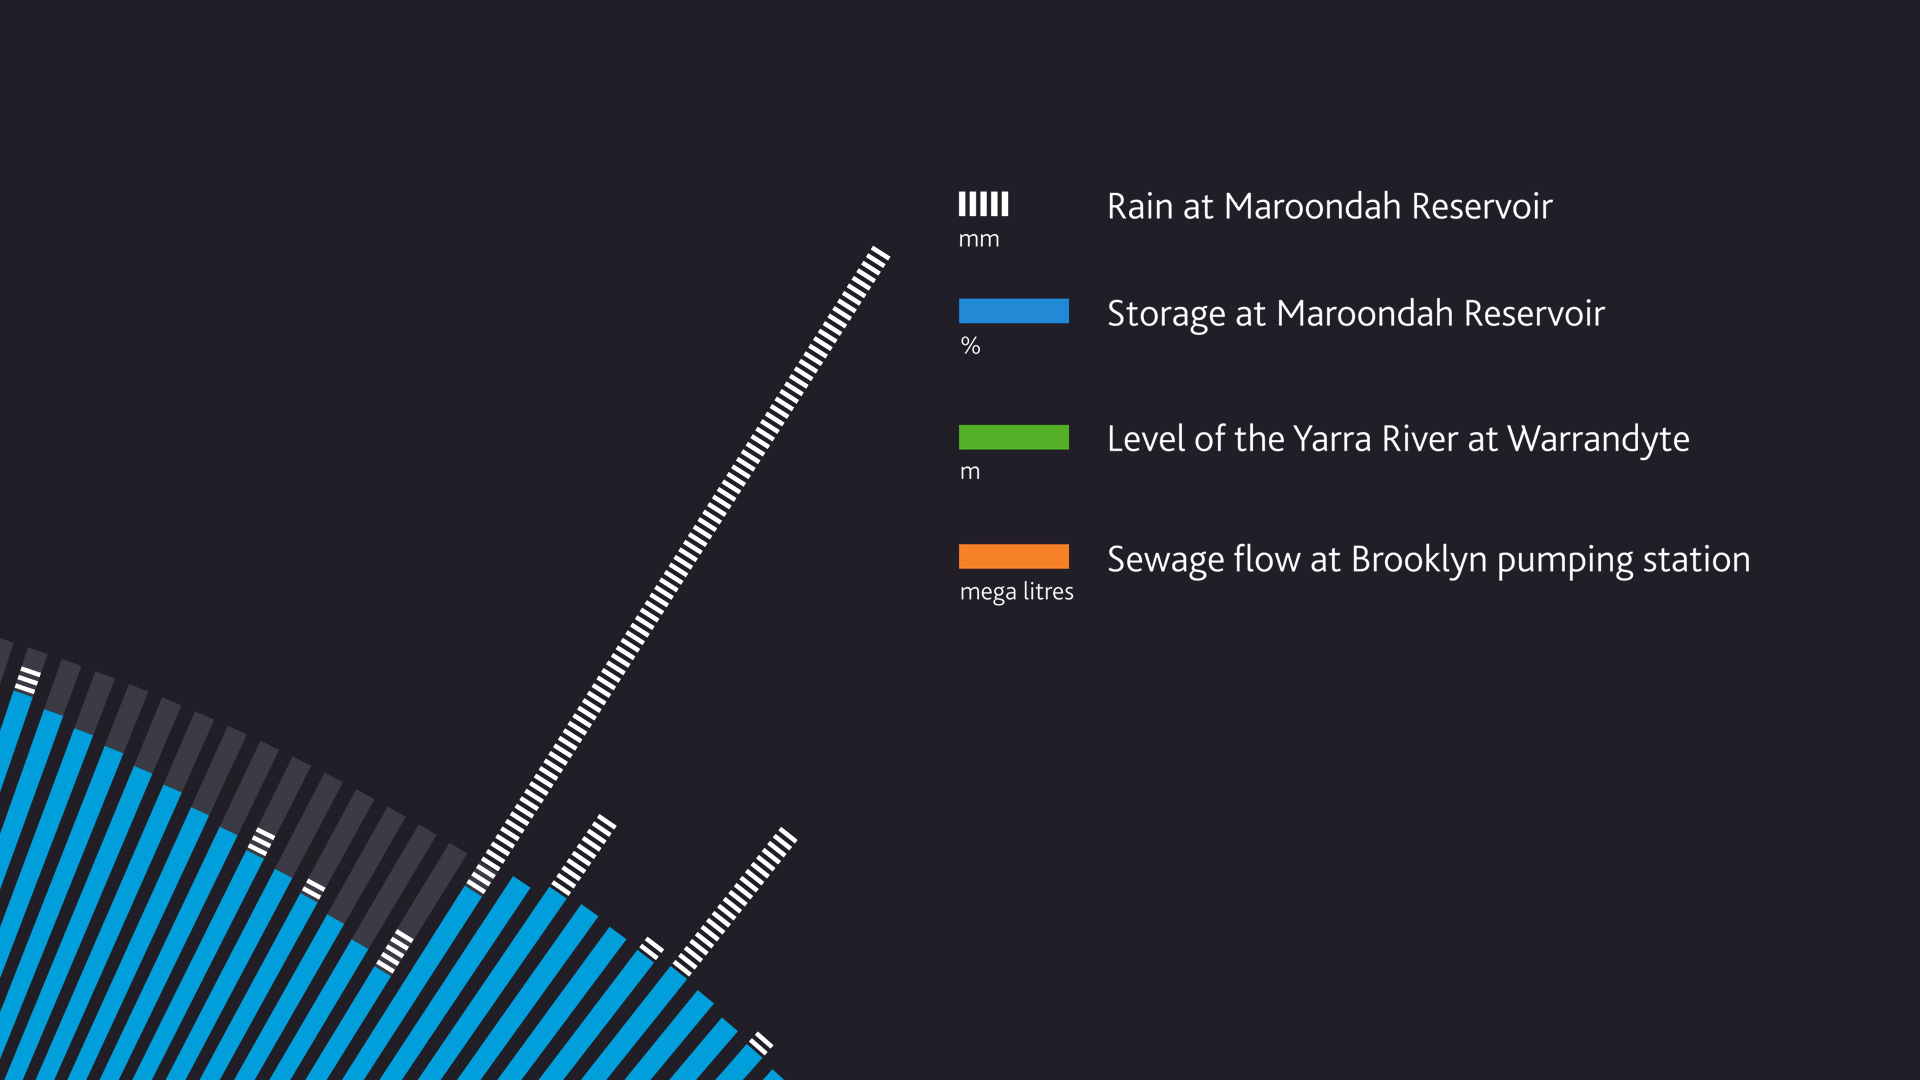
Each day of the year is arranged clockwise around a circle, and then the values for rainfall, reservoir storage, river level, and sewerage are plotted on these days. Immediately you see how the seasons shape our water supply, the amount of variation there is in a decade, and how our behavioural patterns affect the water output from the city.
As designers we’re interested in how people take away their own readings of the graphics — by understanding a decade of information, a year, or simply a day in the life of Melbourne’s water systems.
OOM Creative developed a realtime 1080p screen and print installation, and 10 large poster designs (2.3 × 1.6 m) on show in Melbourne’s City Square during the festival.
Project Credits
Visualisations: Greg More, OOM Creative
Sound design: Marco Cher-Gibard